TICK stack is an acryonm for a set of open source technologies or projects from that combine to deliver a platform for easily storing, visualizing and monitoring time series data such as metrics and events
The TICK stack stands for
Telegraph: a server agent for collecting and reporting metrics
InfluxDB: a high-performance time series database which uses SQL like syntax to query the data.
Chronograph: a user interface to quickly see the data stored in InfluxDB to build visualization dashboards and alerts
Kapacitor: a data-processing engine that can process, stream and batch data from InfluxDB
The Research Support Services (RSS) group within the Graduate School of Business (GSB) Center & Initiatives for Research, Curriculum Learning Experiences (CIRCLE) supports the research projects of the faculty and students in the GSB.
The RSS uses the TICK stack to monitor various resources the GSB uses like the Yen computer cluster and the AWS EC2 instances which run various projects.
IT Infrastructure, Technical Services uses the TICK stack monitor building energy usage for example.
Stack Process Flow
The Telegraph agent collects various reporting metrics. It can collect system and networking stats, message queue information, log and trace files and other information from the systems it is running on.
Telegraf stores this information in InfluxDB which is a time series database or data store which uses SQL-like query language to interact with the data. One can build SQL query based on use case requirements from the captured measurement variables.
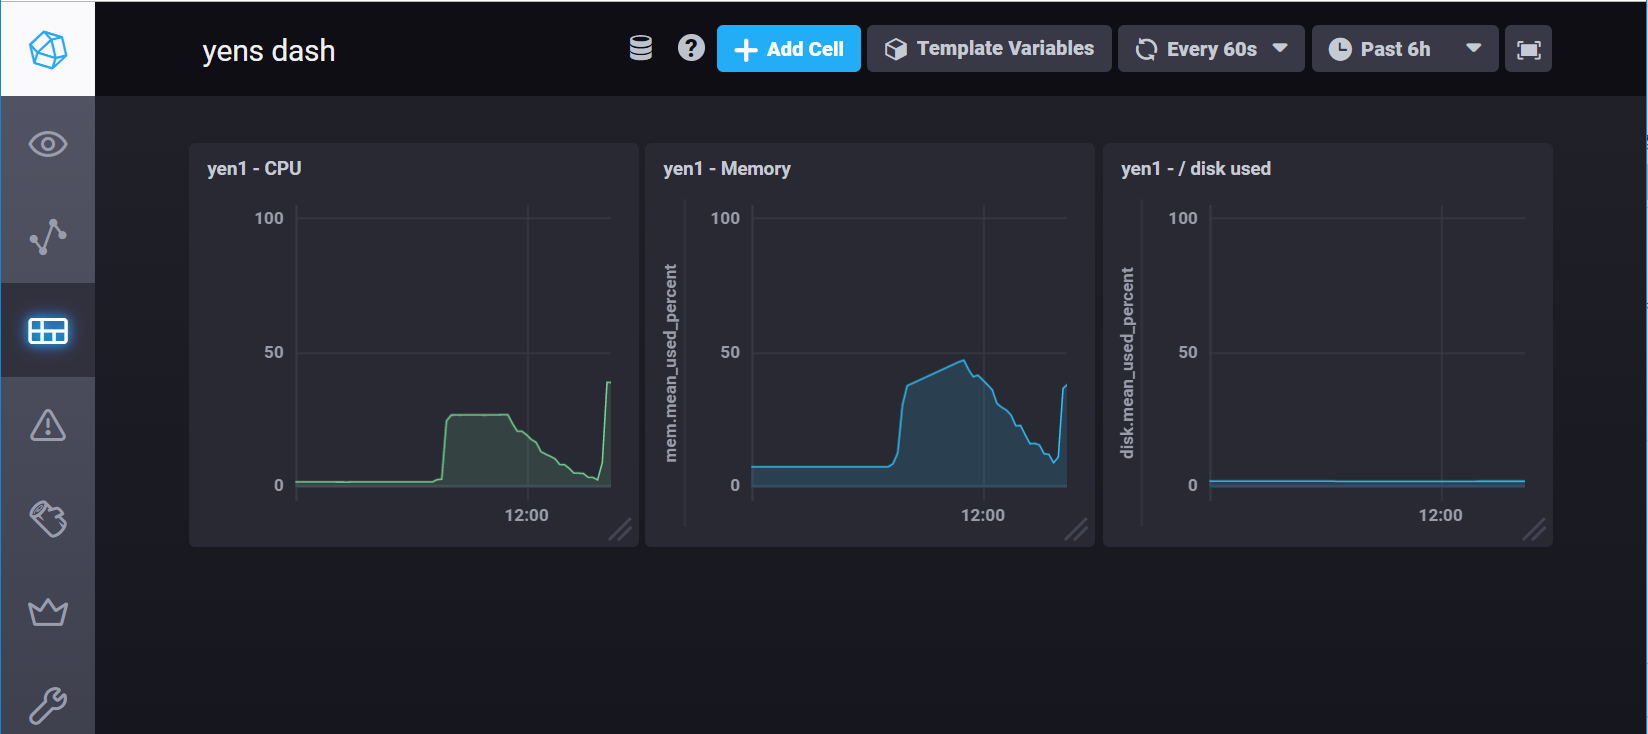
Chronograph is an easy to use visualization tool that ingests the Telegraph query which uses the measurements selected in the query as components to build custom dashboards.
Kapacitor is a data processing engine It can process both stream and batch data from InfluxDB. You can build custom logic or user-defined functions to process alerts with dynamic thresholds, match metrics for patterns, compute statistical anomalies, and perform specific actions based on these alerts.
See https://www.thoughtworks.com/radar/platforms/tick-stack for more information.