What does it take to keep our faculty, staff, and post-docs equipped with the computers and other IT hardware they need to do their work at Stanford?
A recent survey led by Business Affairs has revealed the answer — and it may surprise you.
Findings from the survey indicate the total amount of time currently required to manage the hardware cycle for 39,000 people is equivalent to the workload of about 102 full-time employees. It is even more astonishing when you consider that this figure excludes the time spent on this type of work by the staff in University IT (UIT), the organization that provides centralized technology services and support at Stanford.
How the survey was run
As part of a university-wide initiative to better understand the IT landscape across campus, the End User Hardware survey aimed to discover how many hours are spent each month to manage the IT hardware lifecycle at Stanford on behalf of others. For the survey, hardware was defined as computers, monitors, headsets, tablets, mobile devices, keyboards, and Stanford-owned personal printers. Lab and shared equipment were not considered.
Nearly 6,000 staff members in 29 academic, administrative, and auxiliary organizations received the survey in February 2022. Only those who engage in activities related to managing IT hardware for employees other than themselves were asked to respond. Data was not collected for setup, configuration, or ongoing support tasks. The survey questions covered all phases of hardware management, including time spent on activities related to:
- Consulting with employees about their hardware needs
- Planning and monitoring the refresh schedule
- Placing, reviewing, approving, and following up on hardware orders
- Tracking and auditing inventory Retiring and disposing of hardware
Survey organizers hope to use this data to enhance Stanford's ability to design improved ways to deliver this IT function in the future. Review the infographic summary below to see more of the survey results.
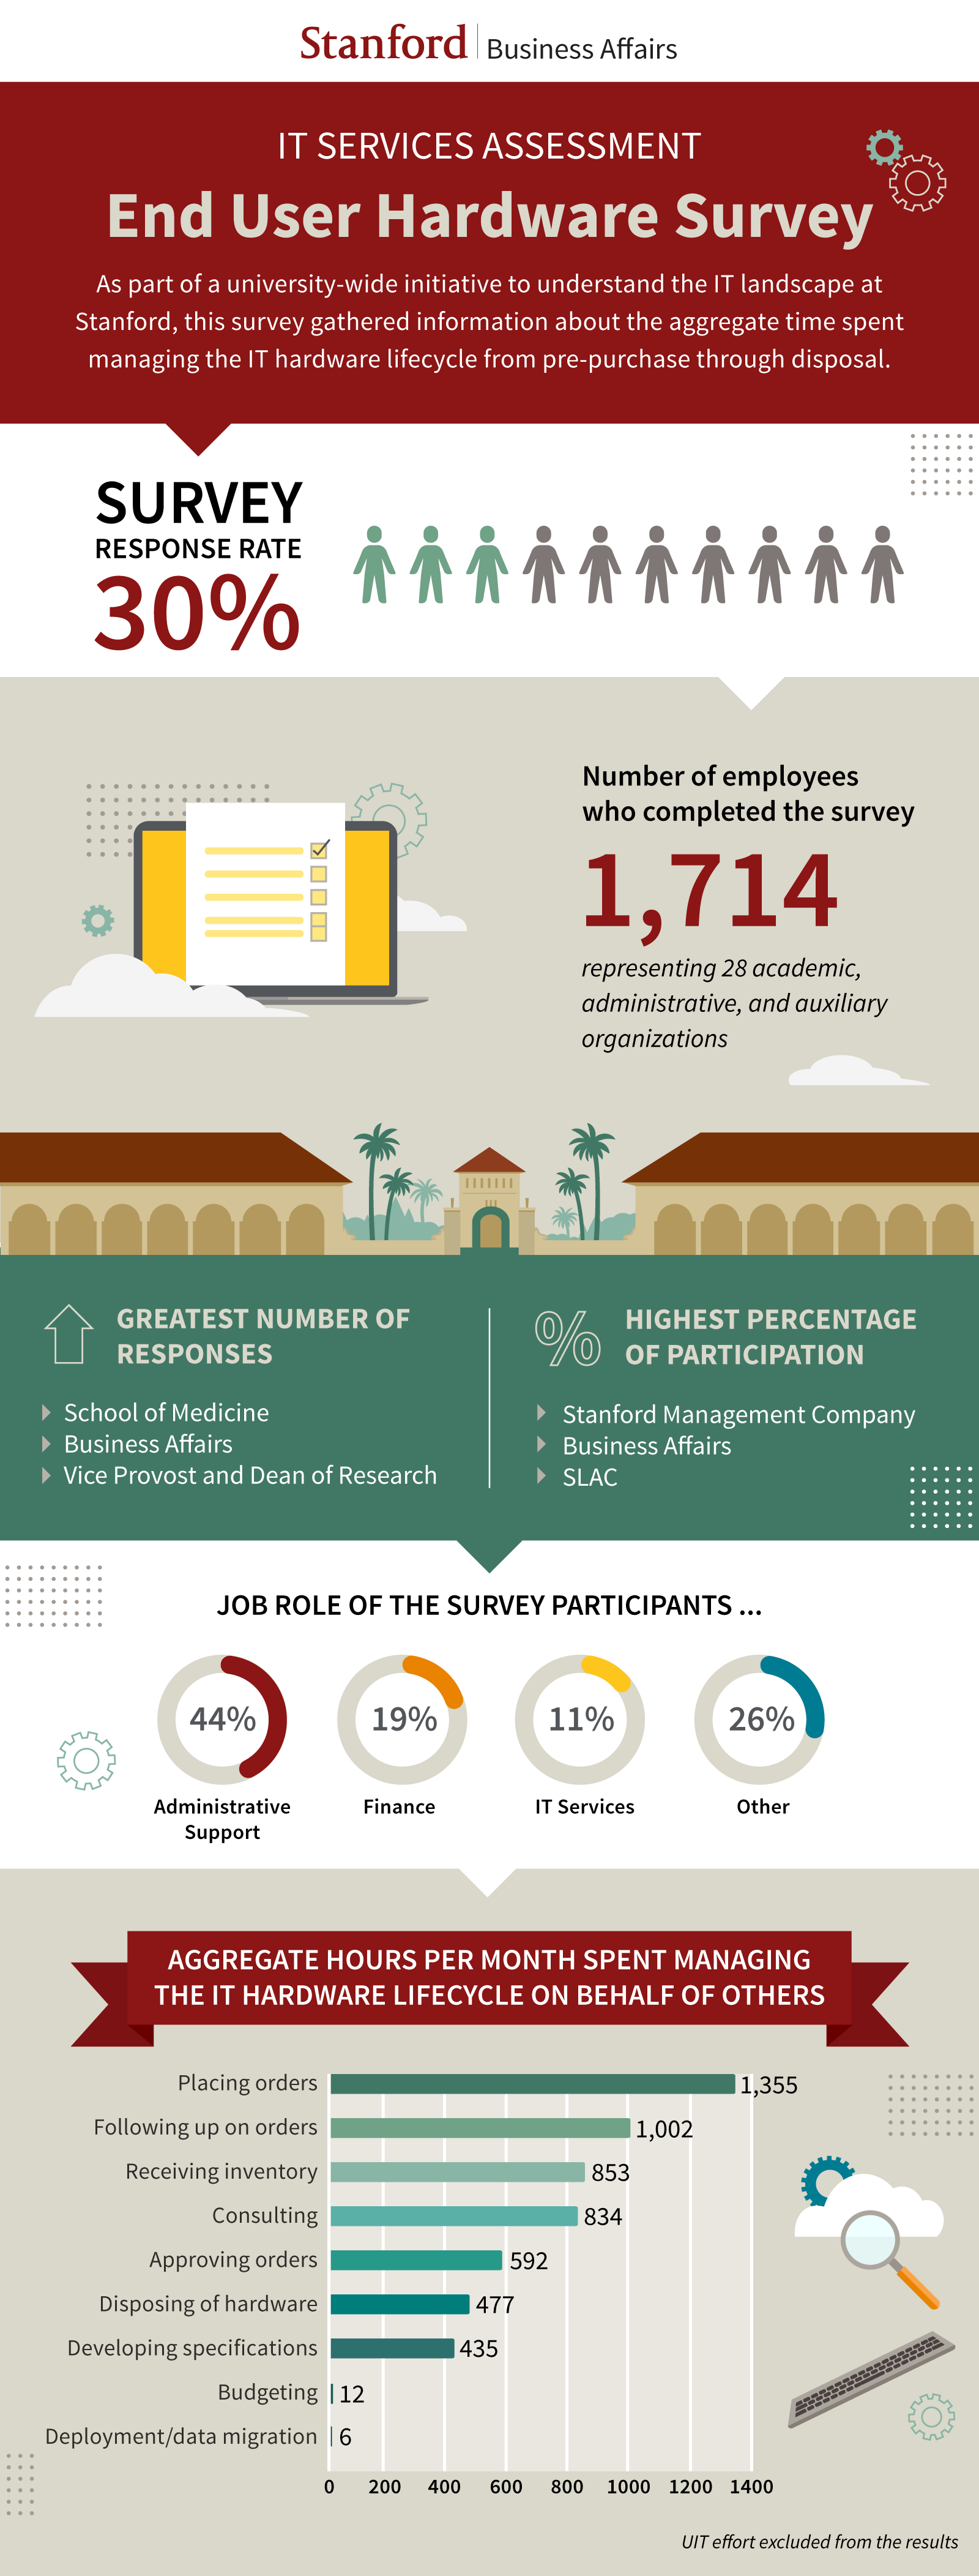
IT Services Assessment: End User Hardware Survey
As part of a university-wide initiative to understand the IT landscape at Stanford, this survey gathered information about the aggregate time spent managing the IT hardware lifecycle from pre-purchase through disposal.
Survey response rate 30%.
Workspace Owner or Admin
Number of employees who completed the survey 1.714
Greatest number of responses: School of Medicine, Business Affairs, Vice Provost and Dean of Research
Highest percentage of participation: Stanford Management Company, Business Affairs, SLAC.
Job Role of Survey Participants
Administrative Support 44%
IT Services 11%
Other 26%
AGGREGATE HOURS PER MONTH SPENT MANAGING THE IT HARDWARE LIFECYCLE ON BEHALF OF OTHERS
Placing orders: 1,355p
Following up on orders: 1,002
Receiving inventory: 853
Consulting: 834
Approving orders: 592
Disposing of hardware: 477
Developing specifications: 435
Budgeting: 12
Deployment/data migration: 6
UIT effort excluded from results.